Showing posts with label ^GSPC. Show all posts

Tuesday, November 25, 2008

The benefit of a concentrated portfolio

Today is my portfolio's biggest one day change: 16.33%. The S&P 500 barely moved up 0.66%, so my gain came from the stocks I happen to hold. First Marblehead shot up 64.71% because, I suppose, of news that Leslie Alexander (the company's largest investor) bought more shares. Random fluctuation sent Select Comfort up 28.57%. (When a company costs a quarter a share, a few pennies change in price makes a big relative difference.) Berkshire Hathaway is up 8.95% as investors figured out the company is not going to fail after all. So just a few big moves in companies I happen to own make a huge difference.

Of course, there's a cost as well. On the year, my IRA has lost more than half it's value due almost entirely to awful results from First Marblehead (down 91%) and Select Comfort (down 96%). Digging out of a hole like that will be very tough even with days like today. Both these stocks represent value traps that should have been sold long ago. I'd sell Select Comfort today except it will cost too much in commission. (I am shopping some December call options, but my limit price won't be filled any time soon, I think.)

Friday, November 21, 2008

Best one-day return ever

My IRA shot up 10.93% today. Of course, it's still down 62% this year compared to 45% for the S&P 500. So no celebrating yet. My 401(k) is only down 40%.

Friday, October 10, 2008

Shifting to stocks

Because the markets are free-falling and the yield curve has become more favorable, I've shifted my market-timing position from bonds to stocks.

Updated October 23, 2008

I didn't actually publish this on October 10, but I did make the shift on that date in my 401(k) plan. The markets have been choppy since then, but all indications (besides stock prices themselves) say I did the right thing.

Monday, October 06, 2008

Wait 'til next year!

A little over year ago, I posted a list of mutual funds in my portfolio as if they were a baseball team. In that time, the markets have been rocked and it seemed like a good time to review their performances. The statistics (5-year return/expense ratio/turnover ratio) have been updated to include the most recent numbers I can find for them. I'm also commenting on "last-year's season", which I define as 1-year return from October 3. Today's market was way down, so I expect performance to be a bit worse for these funds. My benchmark is -27%, which about what the market has lost over the same period. Brutal.

  1. First Eagle Overseas - 11.59/0.88/34 (CF)
  2. -18.82% — For a fund that has been heavily invested in gold, losing double digits seems pretty bad. Maybe Jean-Marie Eveillard inherited some bad positions. Maybe, like most of us these days, he had a few positions blow up. In any case, the fund deserved its lead-off spot as it beat the S&P 500 and all but one of its teammates.
  3. T. Rowe Price Small-Cap Stock - 4.61/0.71/40 (SS)
  4. -26.46% — At almost exactly league average, OTCFX does not look good and hasn't for a long time. On the other hand, I suspect the environment will turn around as more good companies get beaten down with the bad. For the moment, I'm hanging on, but a lineup change may be coming soon.
  5. Vanguard PRIMECAP - 7.27/0.31/11 (1B)
  6. -20.04% — At 7% better than average, PRIMECAP continues to be a solid performer.
  7. Dodge & Cox International Stock - 10.94/0.65/16 (RF)
  8. -32.89% — At 6% less than the market, my prediction that the fund might be too big for its britches seems to have been correct. As a result, I'm demoting it to a 5% position and considering cutting it altogether.
  9. Oakmark Global - 8.26/1.13/35 (LF)
  10. -26.94% — Oakmark Global has held its own with almost exactly market returns over the last 12 months. Since the US has done better than other countries in this market(!), that's good for a global fund. If the fee were lower, it might well be a 10% position for me.
  11. Raytheon - 16.10/0.00/0 (DH)
  12. -14.4% — Raytheon has done well recently as it collects more government contracts. I continue to pay only slight attention to this position, but I suspect government spending will shift away from defense in the coming years. Hopefully, Raytheon will find a way to follow the money or build more civilian products.
  13. S&P 500 Index - 3.24/0.01/4 & PIMCO Total Return - 4.66/0.43/226 (C)
  14. -27.07% —
    4.49% — Thankfully, the PIMCO fund has been in the lineup this year so I get a modest positive return rather than the dreadful negative return. Fortunately, I've allowed this position to grow to 25% of my account. As of tomorrow after the close, I will have sold some of this portion to rebalance the lineup. I'll be favoring funds that have performed well over the last 12 months and that I have confidence in.

    The next question is: has the market fallen far enough to shift from bonds back to stocks? As I noted when I originally bought the fund, the inverted yield curve was my primary reason for switching to bonds. Conditions have been turning to start favoring stocks, but it's taken most of the year. I anticipate switching shortly after the Federal Reserve meets again to lower rates at the end of the month.

  15. Turner Emerging Growth - 8.54/1.55/88 (2B)
  16. -25.81% — I haven't expected much from this fund and I haven't been disappointed. The return has been only a little better than average, but that makes it one of my better positions this year.
  17. Fidelity Equity-Income - 2.57/0.67/24 (3B)
  18. -33.40% — I don't plan to add money to Fidelity Equity-Income unless and until there is some compelling reason to do so. Underperforming by 6% or so, is not compelling.
  19. Columbia Value & Restructuring - 5.36/0.94/11 (P)
  20. -34.37% — Excelsior Value & Restructuring has been renamed to Columbia Value & Restructuring, but it has the same management and structure. In a recent interview manager Dave Williams suggested that some restructuring situations take five or more years to develop. I'd hoped that this fund would be counter-cyclical, but it seems to have suffered from fewer buy-outs and mergers in the last 6 months or so.

-19.9% — My fund team has not performed as well as I'd hoped during the downturn in the market, but better than the market as a whole. PIMCO Total Return was the hero of the group as might be expected. Among the stock funds, First Eagle Overseas and Vanguard PRIMECAP earned their high spots in the batting order. Next year, I hope to report the S&P 500 anchoring a strong lineup of stock funds to make back some of this year's losses.

Tuesday, January 22, 2008

Yield curve strategy nears turning point

When the Federal Reserve knocked short-term rates down 3/4%, I took at look at the current yield curve to see if it has become attractive. It still looks flat to me, so I'll stick to the PIMCO Total Return fund for now.

The Total Return fund returned 9.07% last year compared to 5.49% for the S&P 500 with dividends invested. That's pretty good, but I made the call about a year too early. The S&P 500 was up 15.80% in 2006 compared to just 4.0% for PIMCO. So far this year, the index is down 9.67% and the bond fund is up 2.66%, so I'm not complaining about being early. In fact, I think the nature of the yield curve signal requires an early switch when the curve becomes inverted.

As we saw today, the Federal Reserve controls the short end of the yield curve. When it wants to stimulate the economy, it pushes down rates and tries to raise them when the economy seems to be functioning well. Market forces controls the long end of the curve. Since there is little default risk in US bonds, the market mostly concerns itself with beating inflation over the life of the bond. In general, the longer the bond the more yield investors demand to compensate for inflation risk over the life of the bond. Since inflation and economic activity are closely related, you could rephrase those goals so that the Federal Reserve is fighting inflation and the bond market is predicting future economic activity, but I think that's overly complicated.

Under normal circumstances, the curve slopes up as the term of the bond increases. When the short-term rates go up because the economy is functioning well, the long-term rates go up too because of an increased expectation of inflation. On the other hand, when the economy is in trouble, there isn't as much inflation to fear in the future. So there is something strange going on when the curve is inverted. Specifically, the Federal Reserve thinks the economy is doing fine and the bond market isn't worried about inflation, which seems like the best of all worlds—the so-called Goldilocks economy.

And for a while, it is the best of all worlds as the economy hums along with no sign of rising prices. But it also means that most people let down their guard against "bad things". There is also an inherent risk that people will borrow long and loan short to profit off of the inversion. When the curve snaps back to normal, the profit vanishes and the position becomes an expensive liability. Leverage will increases the pain. You might think this only happens to hedge funds and Wall Street types, but how many stories have you heard recently about people taking money out of their home's equity to buy cars or go on vacation? One of the reasons people were willing to do that sort of thing was that borrowing against home equity was so cheap and easy.

So an inverted yield curve marks the moment when everything is working about as well as can be expected and conventional wisdom says there is nothing to be worried about. And there isn't until suddenly, there is a lot to worry about. The Federal Reserve responds to economic trouble by pushing down the short end while the market responds to future inflation by demanding more yield on the long end. When we see a normal to steep curve, the fear permeates the economy and it's time to switch from bonds to stocks.

Monday, August 06, 2007

FundAdvice.com's advice about my funds

FundAdvice.com publishes advice on various 401(k) plans, including the one at Raytheon. A striking aspect of the suggestions is how few funds they picked—especially for the "Aggressive" portfolio. My comments on the funds I didn't pick:

  • Vanguard Windsor - 15.18/0.25/38
  • If Vanguard PRIMECAP was not offered in the Raytheon plan, Windsor would likely take its place. Compared to its Vanguard brother, Windsor has slightly underperformed with lower expenses and higher turnover. I suppose I have slightly more confidence in PRIMECAP compared to Wellington management.
  • American Century Small Cap Value - 15.89/1.05/121
  • The analogous funds I own are T. Rowe Price Small-Cap Stock and Turner Emerging Growth. American Century combines the lower performance of the former and the high expenses and turnover of the later. It's hard to get excited about that combination. Small company funds are a definite weak point of the Raytheon plan.
  • Real Estate Securities Fund - 27.55/?/?
  • This fund is a specialty REIT fund that entered the Raytheon plan on 01/01/2003, which is also the start date for the "5-year return" listed above. We have almost no other information, including expenses and turnover. The top holdings don't mean very much to me and I'm not terribly excited about adding Real Estate exposure at the moment.
  • BGI EAFE Equity Index - 20.37/0.10/7
  • I like index funds, but I already have three actively managed funds that I think do a better job than this index. The unbeatable thing about index funds is their low turnover and fees, and consistently average returns. Foreign stock funds are better candidates for actively managed funds that have the ability to out-perform the benchmark.
  • Stable Value Fixed Income - 5.09/?/?
  • I'm going to assume this is the same fund that is now called the Fixed Income fund. If not, my comments would likely still apply. Recently PIMCO made some bad guesses about the bond market that have cost investors a bit of return lately. But each month (roughly) we hear the thoughts of Bill Gross, the Total Return fund's manager. In contrast, there is nearly no information about the Fixed Income fund, which is only found in the Raytheon plan. A bond fund for me serves as a piece of a market timing strategy in which I try to avoid market losses by holding relatively stable bonds. The yield I earn in times of market risk, such as at the moment, is purely a bonus as far as I'm concerned.

I have also put into place a fund allocation scheme that I think I can follow. With 10 funds, each would have a 10% or so share in my portfolio if I were equally comfortable with their prospects. But some funds (Excelsior Value & Restructuring, Vanguard PRIMECAP, and First Eagle Overseas) deserve an extra share (15%) since they seem better bets than the others. In order to make rooms, those funds are paired with funds (Turner Emerging Growth, Fidelity Equity-Income, and Oakmark Global) that I don't have as much confidence in which will receive a half share (5%). If I were to gain greater confidence in a fund (perhaps Value & Restructuring), I could assign it a double share (20%) and pair it with either two half-share funds or eliminate a position altogether.

Note that this allocation doesn't exactly match the "batting order" I presented last week, even if the pitcher spot is given a greater role based on defense. Diversification with my IRA holdings knocks down the value of owning Oakmark Global. I'm not happy with the small company choices Raytheon offers, including the T. Rowe Price Small-Cap Stock, and that segment is well-represented in my IRA.

I've also designated PIMCO Total Return as my "gateway fund". It receives all deposits initially and diverts them to funds that are getting underweight. I had planned on using another fund for this purpose, but I just learned that the redemption fee for short-term trading is no longer going to be charged.

Thursday, August 02, 2007

Ten little mutual funds

It's been a very long time since I looked at my 401(K) options. I have a hard time talking about these funds because there isn't a lot going on with them. Unlike a stock like Canon which has more news each week than I could possibly comment on, mutual funds barely look different from one year to the next. So I thought it might be fun to look at the 10 funds I currently hold as if they were a baseball lineup. The statistics are 5-year return/expense ratio/turnover ratio. Higher is better for return (obviously) and lower is better for the other two. The lineup (with the exception of the pitcher spot) is roughly the order I feel comfortable with these funds in the future. Overseas funds belong in the outfield, small-cap funds are middle infielders, large-cap funds play corner infield, index and bond funds play catcher, and the special-situation fund is pitcher.

  1. First Eagle Overseas - 23.04/0.89/28 (CF)
  2. Jean-Marie Eveillard is once again the manager of this wide-ranging fund. He recently replaced Charles de Vaulx, who left for some reason I've never found out, but he'd had 26 years managing the fund before his premature retirement. Currently the fund is most heavily invested in cash and gold, so it ought to be able to invest in bargains as the markets head south. Some of the bigger holdings are international brands such as Nestle, Toyota, Shimano, and L'Oreal, but many more or obscure to me at least. In many ways having a fund managed by a Frenchman is more diversifying than yet another New York or U.S. based fund.
  3. T. Rowe Price Small-Cap Stock - 15.71/0.91/20 (SS)
  4. Gregory A. McCrickard has led this fund for 15 years. The five year return looks good until you compare it to the small-cap stock universe or the funds in this category. Both sport returns several percentage points higher. Unfortunately, there aren't a lot of choices for investing in small companies offered by my 401(k) plan. Small-cap investing ought to be where active management shines, so I'd like to get at least one fund in the mix even if it isn't the best in category. Both the management fee and turnover signal that the T. Rowe Price fund is a better bet than the Turner fund listed below.
  5. Vanguard PRIMECAP - 17.53/0.31/10 (1B)
  6. PRIMECAP is managed by a company of the same name based in Pasadena. Howard B. Schow, one of six credited managers, gets a cameo in the most recent revision of The Intelligent Investor discussing the idea that management ought to be held accountable for the goals they establish for themselves. It's not a good sign when a manager talks up margins until they start to contract and talks about sales growth instead. I like this fund both for its exceptional performance, but also for its very low expenses and turnover. Among its top holdings are Oracle, Adobe, FedEx, Microsoft, Sony, and Potash Corporation of Saskatchewan, Inc. There are a lot of good ideas in there, but I wish I knew more about how the companies are picked.
  7. Dodge & Cox International Stock - 24.72/0.66/9 (RF)
  8. This fund is managed by a team, which ought to help when allocating the fund's large and growing asset-base. One fairly recent addition to the portfolio is a Norwegian energy and aluminum company called Norsk Hydro ASA. There are also names like Nokia, Honda, News Corp., Shell, Bayer, and Volvo that most Americans will know. The fund seems to be widely recommended and has done exceptionally well, so it runs the risk of growing larger than its ideas. Thankfully the expense and turnover ratios bode well for the future.
  9. Oakmark Global - 22.44/1.18/41 (LF)
  10. Clyde S. McGregor has managed Oakmark Global for most of the last five years and added Robert A. Taylor as a co-manager two years ago. International funds have been a particularly easy category to make money in recently, so I have some concern this team is not as good as its record. But it is a very good record and I suspect that global funds will continue to outperform their more limited brethren. The expense ratio is pretty high, but since this is a newer fund it might creep down in time. Also, I'm happy to continue paying for exceptional performance. Oracle is one of the fund's larger holdings which makes my overweighted position in the software company overweighteder as I add to the fund.
  11. Raytheon - 15.5/0.00/0 (DH)
  12. I no longer closely follow Raytheon, but from the inside we seem to be doing fairly well. A few years ago, we were allowed to diversify away from company stock in the company 401(k), which I take full advantage of. Despite raising the dividend recently, Raytheon's yield has dropped from 2.66% in 2004 to 1.82% today.
  13. S&P 500 Index - 10.73/0.01/4 & PIMCO Total Return - 4.84/0.43/257 (C)
  14. This platoon is my basic market timing experiment. The S&P 500 index fund is the cheapest way to participate in bull markets and PIMCO is a fairly safe place to earn bond yields when there is a bear market. I've been invested in the bond portion of this position for a year and a half based on an inverted yield curve. I've missed out on some nifty gains (though only in this position), but PIMCO Total Return and Raytheon are the only two investment that have not lost money over the last month. I don't plan to switch back to stocks until the yield curve returns to a more normal configuration.
  15. Turner Emerging Growth - 19.81/1.54/78 (2B)
  16. Frank L. Sustersic and William C. McVail are closing in on 10 years running this fund and Heather McMeekin was hired five years ago. Like the T. Rowe Price fund, I've focused on Emerging Growth in order to have small companies represented in my fund portfolio. Five-year return looks great, but the expenses and turnover are a concern. Cash represents 12% of fund assets at the moment and I don't recognize many of the stock holdings. Deckers Outdoor Corporation, which makes Teva sandals and Uggs boots, stands out as a large holding I recognize. Almost a quarter of the stocks my market value are industrial materials manufacturers according to Morningstar.
  17. Fidelity Equity-Income - 13.80/0.67/24 (3B)
  18. Equity-Income has been on my radar for a very long time, but it isn't terribly exciting so I haven't started building a position until recently. Stephen R. Petersen has served as manager of this fund for 14 years, so he can certainly take credit for its current record. The current yield is 1.56%, which doesn't seem particularly high for an "Income" fund. On the other hand, expenses are reasonable and the fund has outperformed the market since the peak of the internet bubble of 2000. I won't bore you with the names of the top investments because they are exactly what you would expect this sort of fund to own. I don't plan on letting this be a large part of my 401(k), but it seems a reasonably defensive choice.
  19. Excelsior Value & Restructuring - 19.18/0.84/13 (P)
  20. This fund is actually my favorite fund in the bunch which I saved until last because I don't know what to do with it. David J. Williams, the fund's manager for 15 years, has focused on companies that are experiencing some sort of shift either internally or within their industry. For instance, he bought Tyco after the story of its extravagant CEO brought down the price and continues to hold some of the companies that spun off Tyco earlier this year. He also invested in Deluxe Corp., which dominated the paper check business and is now struggling to find new sources of revenue. These deals don't always work out, but the fund's performance is pretty exceptional. I think if I were forced to pick just one fund to hold, it would be this one. Special situation investing can be more laborious and error-prone than simply buying big companies with good earnings, so I don't mind paying the very reasonable fees.

My favorite funds are those that open up the black box just enough for investors to take a peek inside. My 401(k) doesn't have many funds that are as open as Pimco has been over the years, so I need to search a bit more than I'd like to get to know the managers and their styles. Ten funds seems like a lot when compared to the more compact portfolio of my IRA and much of that is due to the sparse information available. I don't want to assign strict 10% allocations to these funds, since they vary in quality and likelihood to outperform. I think this post will help me sort out what the final allocation ought to be.

Monday, January 09, 2006

Why I'm buying the PIMCO Total Return bond fund

For the past year or so, I've been concerned about my original strategy of investing heavily in an S&P 500 index fund. For one thing, I've been investing in active funds that beat their index over the course of several years. Also, it seems like the index is biased toward expensive stocks. I still like the low fees, but I'm concerned that the indexing strategy will be costly if there is a recession—especially since P/E ratios are so high.

Recently, the yield curve inverted slightly. So I decided to move about half my index fund "ballast" into a bond fund.

I only considered funds with expense ratios < 0.5% and manager tenure of 10 years or more. Here are the returns for all candidates in my 401(k) plan:

Investment Name   1 Yr 3 Yr 5 Yr 10 Yr LOF
PIMCO Total Return Inst CL 2.58% 4.89% 6.84% 6.98% 8.54%

PIMCO Total Return is the largest of all bond funds in terms of net assets. For a stock fund, that would be a huge negative, but a bond fund should scale better. Costs are everything in bond funds, since there is little room to differentiate on the basis of picking individual bonds. Unlike stock funds, size doesn't lock bond funds out of the best investments.

Tuesday, November 16, 2004

Earnings yield

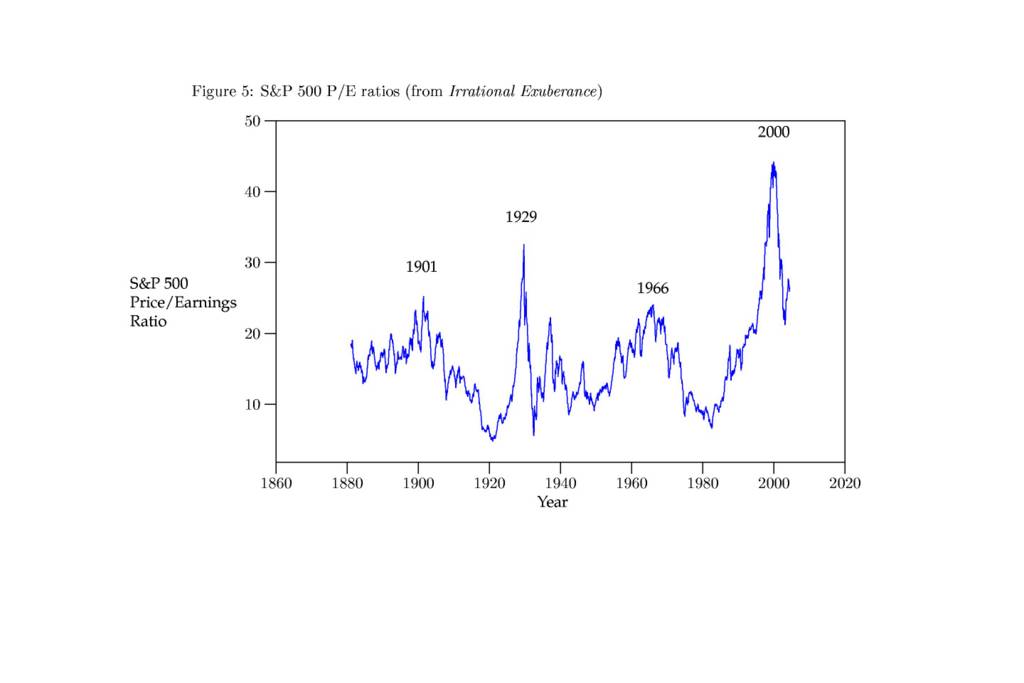
Another striking chart in Irrational Exuberance shows a history of P/E ratios for the S&P 500 with "bubble" years (1901, 1929, 1966 and 2000) marked at P/E peaks. Perhaps the most striking part of the graph is the most recent bubble which boasted a ratio near 45 compared to 25 in 1901, 32 in 1929, and 24 in 1966. Looking at the right side of the graph, it's easy to imagine a depression on the same scale as the 1930s! Once again, I think there are some misleading elements to the chart.

Previously I suggested that 15 might be a fair P/E ratio for the S&P 500, but that's obviously a simplification. For one thing, if when earnings are expected to grow in the future, it would be sensible to pay more for them now. That's why people bought companies like Amazon and Yahoo before they started turning a profit. Obviously some people overpaid for those growing earnings, but it's difficult to say exactly what P/E ratio is fair. (Yahoo entered the index in December of 1999, so it contributed to the record bubble valuation.)

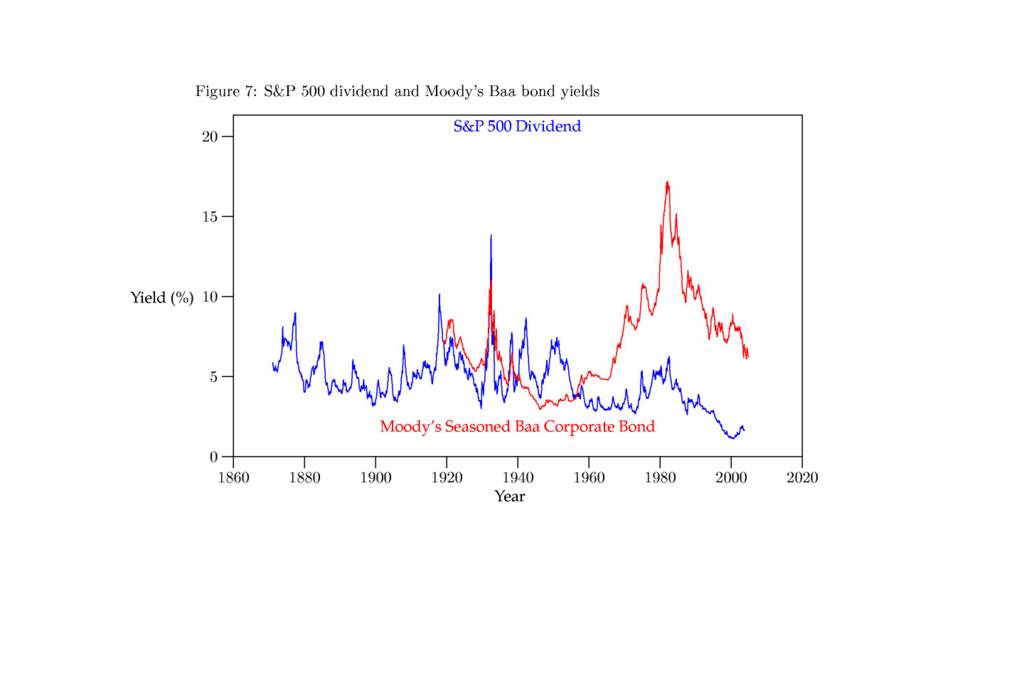
A difficulty with P/E ratios is that the don't mean much without context. One way to fix that is to convert them into earnings yields (earnings/price * 100%). It should be obvious that an earnings yield can be compared to bond yields, and therefore during periods of low interest rates earning yields should be low (and P/E ratios high). The logical bonds to compare to would be corporate bonds such as Moody's Baa. (Seasoned bonds are bonds sold on the open market.) If you look at the right-hand side the chart which shows that relationship, it looks highly correlated.

But what happened before 1960 or so? One obvious difference is that companies made a transition from paying dividends to retaining earnings. The left-hand side of the chart comparing dividend yields to bond yields correlates better than earnings yields. There are still unexplained divergences in the 1950s and I really should measure the correlation rather than eye-balling it, but I think the results are better than bare P/E ratios.

None of this, of course, changes the conclusion that the S&P 500 is currently richly priced. Earnings must grow dramatically to compensate for the risk of owning stock rather than holding bonds. Remember, bondholders get income now and priority in the event of bankruptcy proceedings.

sp500_5.jpg


Posted by Hello

sp500_6.jpg


Posted by Hello

sp500_7.jpg


Posted by Hello

Tuesday, November 02, 2004

Value

I recently finished Irrational Exuberance by Robert J. Shiller which suggested in 2000 that the U.S. stock market was overvalued. And of course, it was. Dr. Shiller suggests that people overvalue the market (defined by high price to 10 year average earnings ratios), when they think the old rules no longer apply. For instance, in 1929 people thought new technology, easy credit and popular interest in investing meant that high P/E ratios were sustainable.

It doesn't take much in the way of mental gymnastics to imagine each of these things being said in 1999. The Internet, Globalization, and Mutual Funds seemed poised to sustain higher earnings growth than anyone could have imagined 5 or 10 years earlier. (The book discusses lots of factors that contributed to bubble valuations, but these are the ones I remember having an impact on me -- right at the start of my investment experience.)

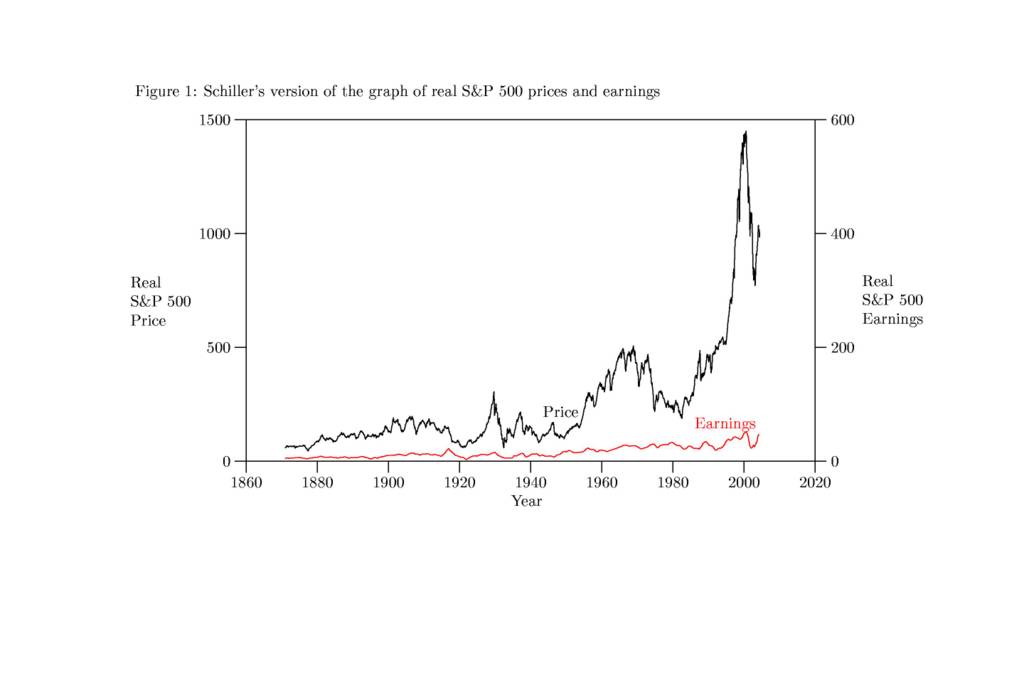
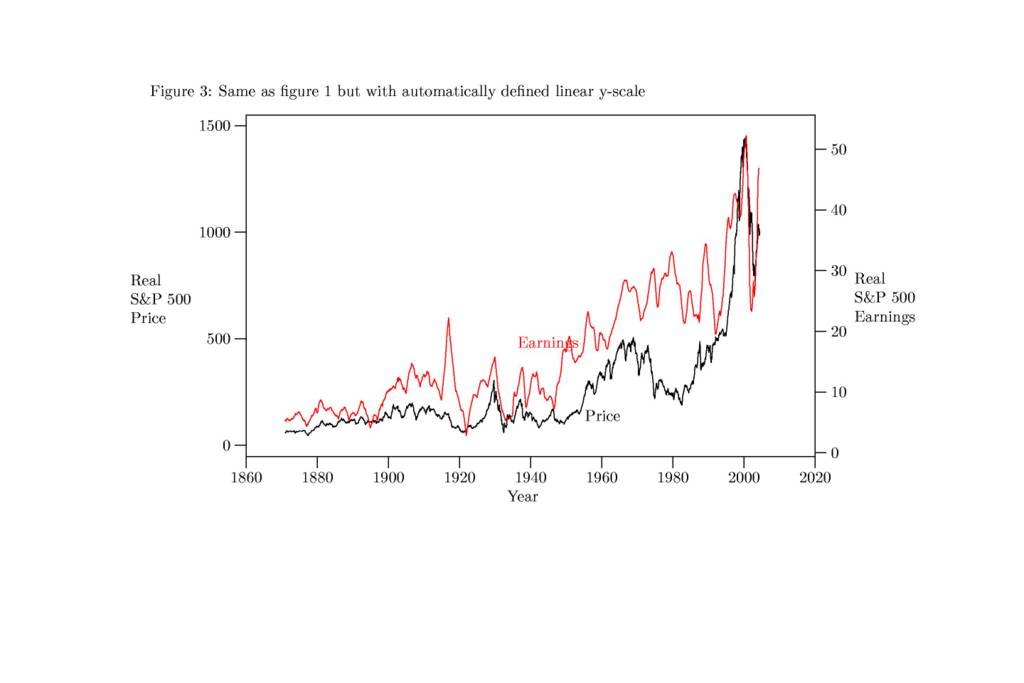
One of the most striking parts of the book, is a graph showing the rise of stock prices and earnings (as represented by the S&P 500 index) over the last 130 years or so. I've reproduced the figure below. It shows earnings increasing at a moderate rate and prices jumping all over the place. Especially interesting are the booms in the 1920s and 1960s followed by busts in the 1930s and 1970s. From 1982 to 2000 the divergence begins to look especially ludicrous. It sure looks like prices are headed south, despite the recent drop.

But there are a couple of problems with this graph. The tipoff is the scales on the left and the right. The left (price) goes to $1500[1] and the right (earnings) goes to $600, but there is no indication how those scales were chosen. Obviously if both lines were on the same scale, earnings would look nearly flat (since earnings are anywhere from 5 to 45 times smaller than prices). But if we are going to look at different scales, why not pick a scale that matches the range of earnings, say $0 to $55? One problem, from the point of view of selling the book's premise, is that prices wouldn't look so dramatically high.

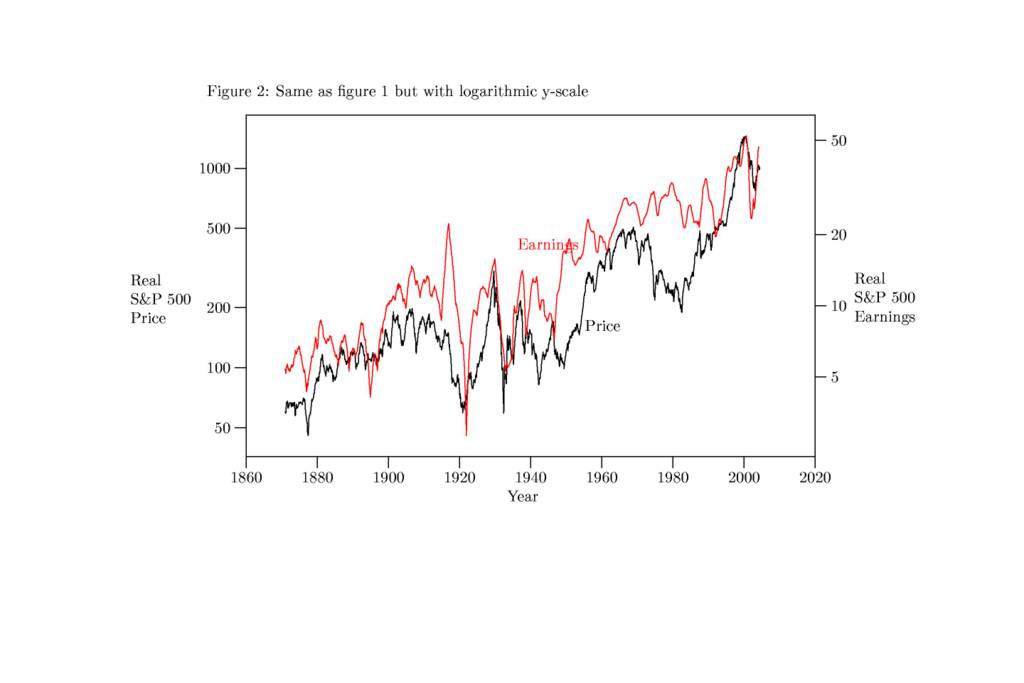
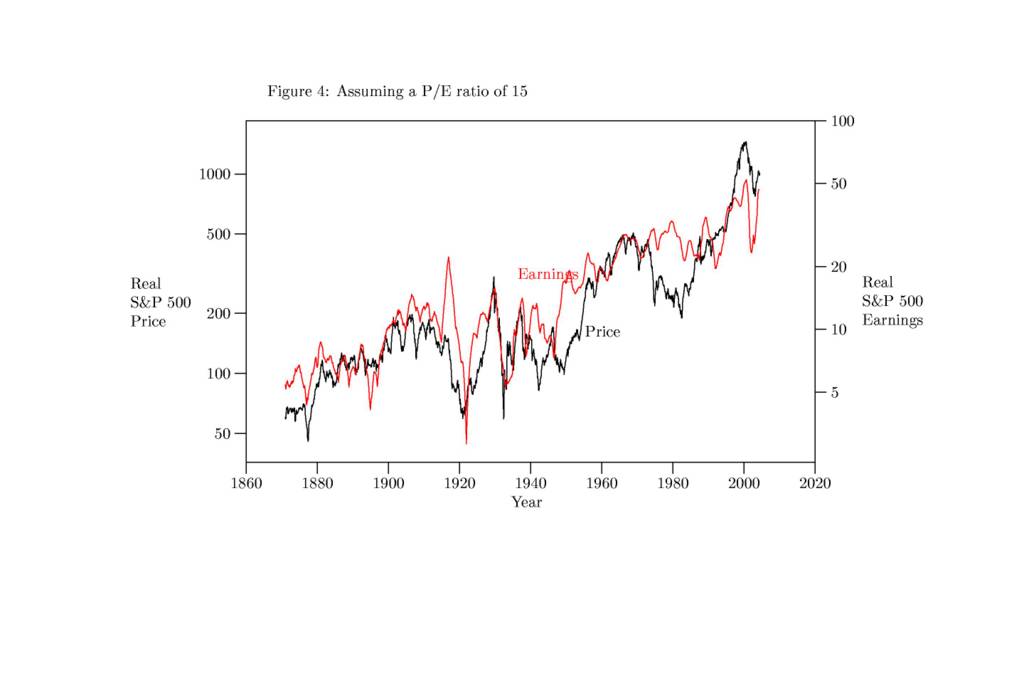
Another issue is that the scale is linear. Even adjusted for inflation, S&P 500 prices and earnings are several orders of magnitude greater now than they were in 1871. On a linear scale, a large move percentage-wise is more dramatic when prices are high and muted when prices are low. If you have a $1000 invested that looses 10%, you're down $100 whether the price per share is $10 or $100. But if you put both changes on the same linear scale, the drop from $100 to $90 is more dramatic than the drop from $10 to $9. One way to correct for this illusion is to use a logarithmic scale. I've used the same data to created a corrected version of the chart.

I'm not saying that Dr. Shiller is wrong or trying to mislead, but this chart is misleading. Earnings and prices don't fit on the same scale, but putting them on the same graph suggests a relationship between them. Implicit in the original graph is the suggestion that P/E ratios should be around 2.5 (since 1500/600 is 2.5). Using a linear graph and letting the graphing software determine the range suggests a P/E ratio of about 27. (Linear graphs are better for accurately determining absolute values.) That's skewed by very high ratios in the last few years.

And this is the frusterating aspect Irrational Exuberance -- it makes a strong case that the market was overpriced in 2000, but it doesn't spend much time discussing the fair value of the market. The historical average is about 16 which is again skewed by recent history. I've produced another chart assuming a fair P/E ratio of 15. Years in which the Earnings line ducks under the Price line (such as 2000) would be years when the market is overvalued. Maybe this ratio is fair and maybe it isn't.

A practical question for me, right now, is whether or not the S&P 500 index is overpriced at a P/E of 18. I think it might be.

Footnote:
[1]   I noticed after I made the graph that the original goes to $1600.

sp500_1.jpg


Posted by Hello

sp500_2.jpg


Posted by Hello

sp500_3.jpg


Posted by Hello

sp500_4.jpg


Posted by Hello

Friday, July 23, 2004

Why I buy the S&P 500

When it comes to finances, it is always good to have a benchmark. For instance, for emergency savings, there is no reason to settle for less than the interest rate on short-term Treasury bills unless you need the convenience of a checking account. The benchmark for longer-term investing is the S&P 500 index.

When I first looked at the mutual funds availible to me in my 401(k), only one fund seemed like it might surpass the S&P 500 benchmark -- Fidelity Magellan. But Peter Lynch was no longer its manager. With huge amounts of money invested, it began to resemble the S&P 500, but with more expenses. I decided to watch Magellan's progress and invest in the index fund. As it turns out, Magellan has "returned" -3.17% annually to the index's -2.04% over the last five years.

There are three elements in the success and failure of mutual funds to beat their benchmark: 1) investment skill, 2) expenses, and 3) investment domain. The first and second points are obvious and, in theory, counter-balance. An index fund requires little to no skill, but minimum expenses. A managed fund has more expenses, but rewards investors with more gains from investment skill. In practice, many managed funds fail to beat their benchmark even without accounting for expenses.

The third point, investment domain, is a description of what sort of securities a fund is allowed to invest in. Over a long period of time, stocks of small U.S. companies have returned more than government bonds, for instance. So all other factors being equal, a small cap fund will do better over many years than a government bond fund.

An S&P 500 index fund has low expenses, will match its benchmark and invests in the 500 largest public companies in the United States. It may not be exciting, but it has been the bulk of my retirement savings for the last five years.